UPDATE – April 2023
It is always nice to make predictions and see how it worked out in reality after many years.
In 2016, I had written an article on SaaS companies with the premise- Can Higher Revenue Growth and Market Share help turn Profits Green?
I had concluded SaaS companies must prioritize profitability while scaling their growth. High growth and market share are not the only key performance indicators (KPIs) for success. If you want to be a self-sustaining company for the long term, you need to be profitable, or else you risk becoming an acquisition target, laying off employees, or worse, bankruptcy.
In the era of low interests since the 1980s, companies have prioritized growth versus profitability. Companies have been able to sustain because of easy access to capital. % of companies at IPO that was profitable in 1980 were 91% and in 2021 it was 22% (Source- Jay Ritter, UFL)
Venture capital, low debt financing and Wall Street IPOs were promoting High growth versus profitability.
I predict that even if there are interest rate cuts in the next few years, we are going back to the era of favoring profitability versus growth in the next 5-10 years. Many of the companies will be acquired or file bankruptcy.
I had analyzed the balance sheets of 7 prominent high growth SaaS companies that were high growth companies. Veeva is the most successful SaaS- was profitable in 2016 as well as in 2023. Salesforce has grown with acquisitions, managed to be profitable in 2021 and barely profitable as they have layoffs to cut costs. Workday and Five9 have had negative profitability. Ellie Mae and Netsuite were acquired
Source (Google Finance)
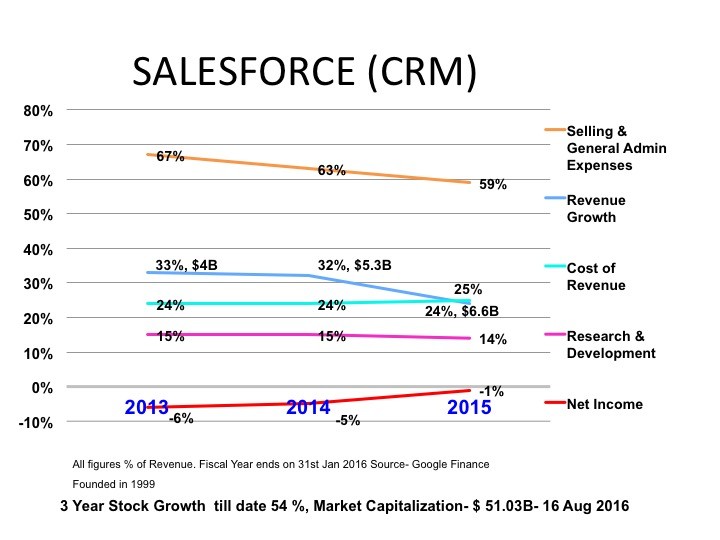
Salesforce- (Founded 1999)-
2016- Growth rate- 59%, Net income (% of rev) -1%
2023- Growth rate- 18% Net Income (% of rev) +0.5% though peaked at 18% in 2021
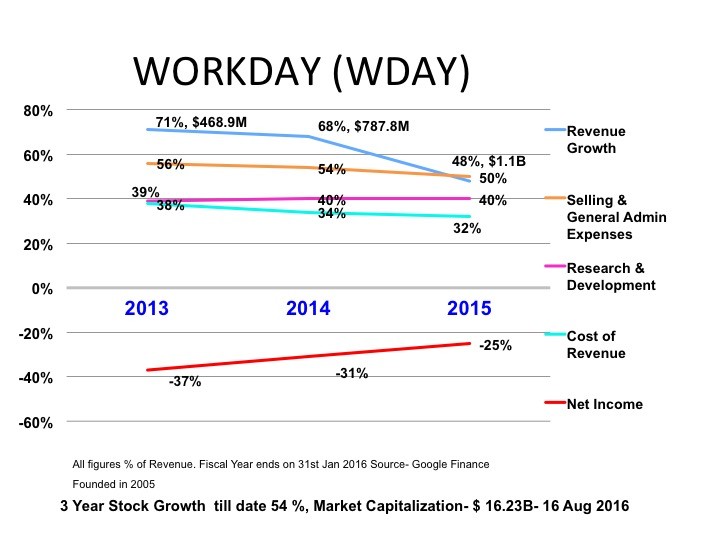
Workday- (Founded 2005)
2016- Growth rate- 48%, Net income (% of rev) – 25%
2023- Growth rate- 20% Net Income (% of rev) -5% though peaked at 0..01% in 2022
Netsuite – (Founded 1998)
2016- Growth rate- 64%, Net income (% of rev) -17%
2023- Acquired by Oracle
Veeva- (Founded 2005)
2016- Growth rate- 35%, Net income (% of rev) 13%
2023- Growth rate- 20% Net Income (% of rev) 22 %
Ellie Mae (Founded 1997)
2016- Growth rate- 38 %, Net income (% of rev) 9%
2023- Acquired by Intercontinental Exchange
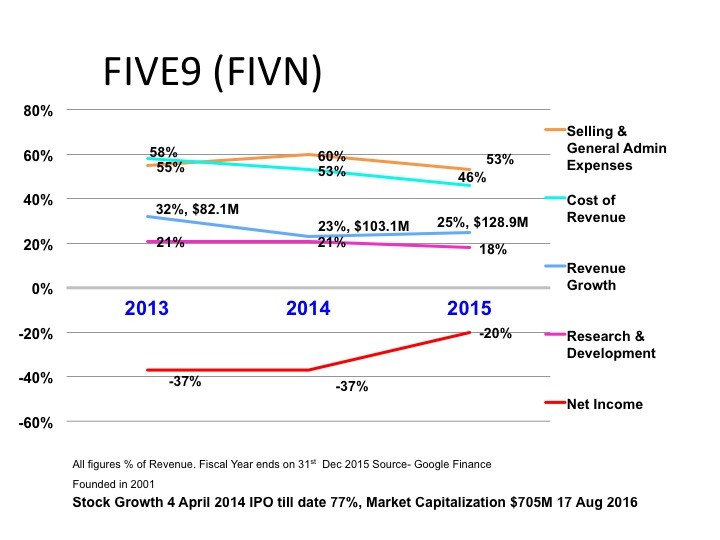
Five9 (Founded 2001)
2016- Growth rate- 18%, Net income (% of rev) -20%
2023- Growth rate- 27% Net Income (% of rev) -12%
Aug 2016
Today the mantra is having High Growth and increasing Market share and the belief is that Profitability will come eventually?
The question I ask is “What is the time span for ‘Eventually’ as many of these companies have been in business for 10 to 15 years and yet to be profitable.
If you asked a businessman in the 20th century, he would ask whether the government is funding such a company? Venture Capital, Low Interest Debt Financing and Wall Street Initial Public Offerings (IPOs )are helping these companies sustain.
The chart below shows that only 11% of Tech IPOs in 2014 were profitable at the time of IPO , which is remarkably different from what it was early 1980s.
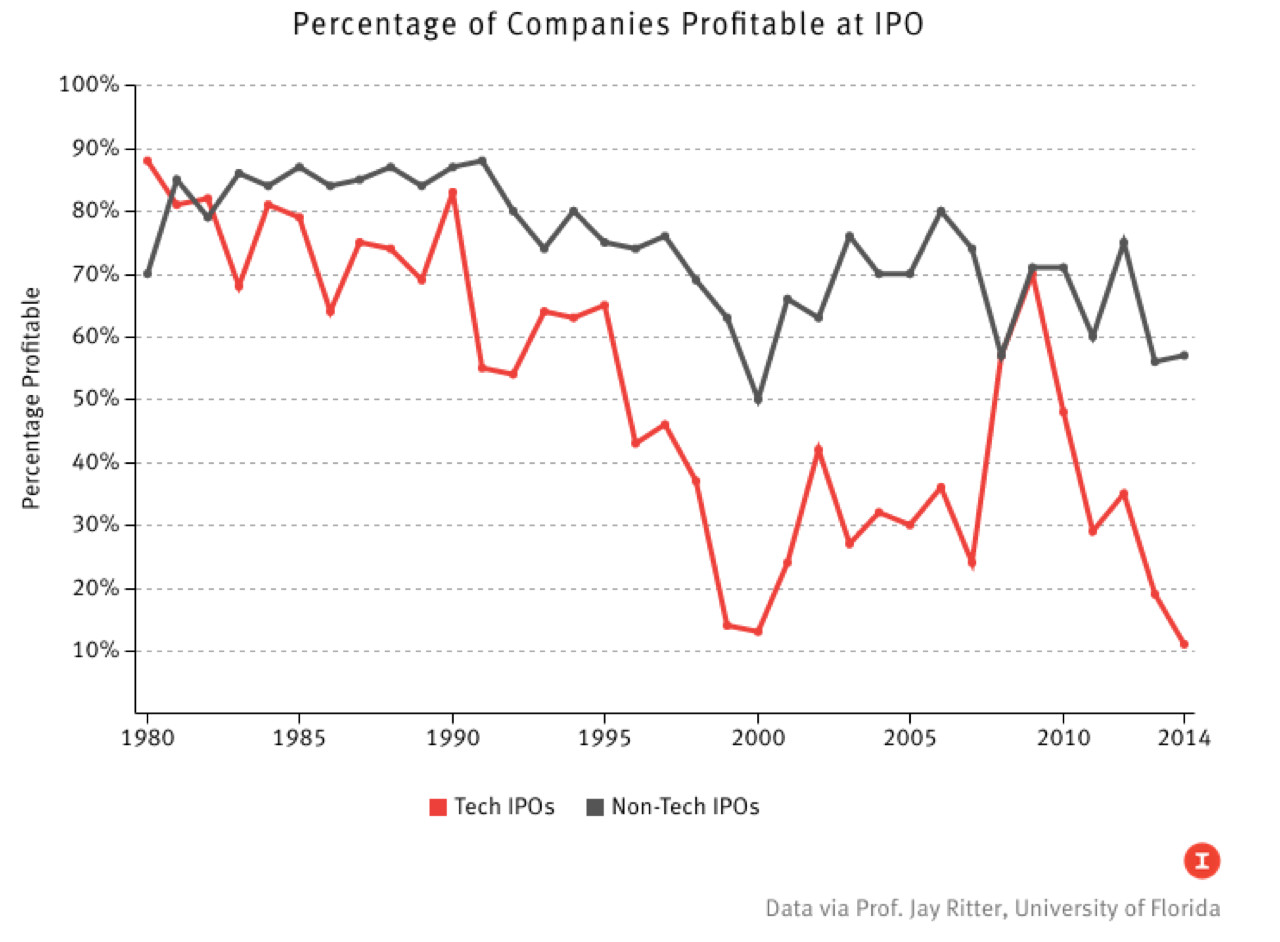
Source- Professor Jay Ritter, UFL Warrington School of Business, Graphic– The Information
Let us look at the Business-to-Business (B2B) Software of the Service (SaaS) industry. Its’ subscription model is disruptive and threatening the On-Premise license model software model.
The popular SaaS advantages cited are customers pay monthly subscriptions, can scale up or down based on usage, do not have to spend on infrastructure and have low total cost of ownership.
The reliability, security and downtime have improved significantly over the years and there is increasing adoption using SaaS.
It is no doubt a great value proposition for the end customers, as they don’t need to pay high on-premise software license fees, regular upgrades, implementation and maintenance costs.
The problem is that most of the major SaaS companies are not profitable or just profitable even after being in business for 10 to 15 years and after their IPOs.
They have been spending heavily on Selling costs (50% to 70% of Revenue) to beat the competition- legacy vendors and other SaaS competitors to gain market share.
The revenue growth is decelerating in the major players and not much money is being spent in Research and Development. Salesforce, the SaaS poster company, is using the acquisition route to complement and enhance its functionalities and offerings.
Most recently, we have seen legacy software vendors feel the pain and have started acquiring companies. Oracle recently acquired NetSuite– a cloud-based financials, enterprise resource planning and omni channel commerce software suites.
The SaaS space is crowded and there are no companies with a lion’s market share of more than 15%.
There is also pricing pressure for the SaaS companies. In their paper,‘Competitive Oriented Objectives: Myth of Market Share’, Wharton Marketing Professor J Scott Armstrong and Monash University Professor Kesten Green, concluded
“Despite evidence from diverse laboratory and field studies demonstrating that competitor-oriented objectives harm performance, the myth of market share lives on among business leaders who prefer to follow their gut instincts.
We expect economic losses to continue at least until textbooks, business school courses, decision aids, and investors’ decisions reflect the evidence that pursuing profit, rather than defeating competitors, is the proper objective of businesses.”
What should SaaS companies do to scale growth as well as improve profitability at the same time?
Scale Growth
- Pricing Strategy– Stick to your pricing and also increase your prices for premium offerings. An interesting read regarding pricing SaaS offerings.
- Product Life Cycle Assessment – Companies should assess their current product offering maturity, what they can do to boost incremental sales and continue to invest in R&D to develop new offerings that compete against non-consumption.
- Competitive Offering Analysis– Demonstrate the value of your offerings as compared to legacy and other cloud competitors. The Strategic Canvas is a good way of showcasing your value and can help command a premium price for differentiated offerings.
- Go to Market Segment targeting– Strategize and target which customer segment would most benefit from your offerings- Enterprise versus SMB Commercial.
- Channel Partner Development– Create an ecosystem of channel partners that will help scale your growth.
- Geographical growth and Market Entry- Evaluate the markets and countries that would benefit from your product offerings.
Improve Profitability
- Influence legacy on-premise software customers to move to cloud based solutions; provide business case of more cost savings to end customer with higher number of seats /subscribers, which ultimately improves your margins.
- Cost Structure- Evaluate the Cost of Revenue- Infrastructure Costs, Fixed versus Variable expenses and Selling General Admin Expenses. There is a myth that you need to grow sales to sell more to improve the top line. There are Sales Productivity techniques that can be implemented such as following up with lead generation and having more cohesiveness between Sales and Marketing. It is possible to do more with less and not burn out the sales team.
- Automated Services and Trainings– Invest in Do it Yourself Services and Click to Chat and Trainings with Recordings.
To sum up, companies should scale growth but not at the expense of profitability.
If you want to be a long term self sustaining company, you need to be profitable or else you will become an acquisition target, start laying off your employees to cut costs or worse end up in bankruptcy.
Though it is not apple-to-apple comparison, Apple just has 15 to 20% of the market share in the smart phone segment but has 91% of the profits in the industry.