

In the world of Big Data Analytics and Alternative Facts, it is essential that we question metrics and look at any issue deeply and holistically.
I present a couple of popular beliefs, where the metrics when viewed individually can lead you to wrong inferences.
Popular Belief- Stock Repurchase (Buybacks) is beneficial to the company shareholders.
If you have listened to the quarterly conference calls over the last fifteen years of the many large Fortune 500 companies, CEOs have announced repurchasing their company stock spending billions of dollars giving the primary reason that the stock price is undervalued.
Wall Street analysts track the Earnings per Share (EPS) metric closely every quarter as it affects the stock price.
EPS = Net Income/ (Average Number of Outstanding shares of common stock)
So stock repurchases are essentially reducing the number of outstanding shares (mathematically decreasing the denominator) whereby increasing the EPS and in turn the stock price.
There is less circulation of stock in the market whereby increasing the demand for the stock. Research shows that the timing of these buybacks is often questionable as the stock price is overvalued.
Warren Buffet has said,
“In repurchase decisions, price is all-important. Value is destroyed when purchases are made above intrinsic value.”
So why do companies buy at high prices?
Many companies incentivize their leadership teams and their employees with stock based compensation, which involves issuing new stock when they are redeemed therefore increasing the number of outstanding shares.
Some of the companies fund their US based acquisitions by issuing stock, as they do not want to pay the 35% repatriated tax rate to access overseas cash.
Companies are also using debt to pay for the stock repurchase due to the low interest rates. So buybacks are balancing acts to keep the average number of outstanding shares of common stock in check.
Popular Belief – US Manufacturing has been declining since the 1960s
It might be surprising to know that US manufacturing output over the last fifty years has been fairly consistent between 12% and 14% of the total GDP in the price-adjusted inflation terms despite Globalization.
It is contradictory that the employment share of manufacturing jobs has seen a steady decline from a high of 25% to low of 8% in recent years.
This is because of the productivity efficiencies with technological automation making some of the jobs redundant.
If you do a deeper dive, there is change in the mix of the industry output as computer and electronics sectors have grown whereas other sectors have declined.
There is also a geographical impact across industries. The point to note is that when one of these metrics is viewed individually, it can paint a very different picture.
Manufacturing Value-Added and Employment as a Share of the Total U.S. Economy, 1960–2011 (in 2005 prices)
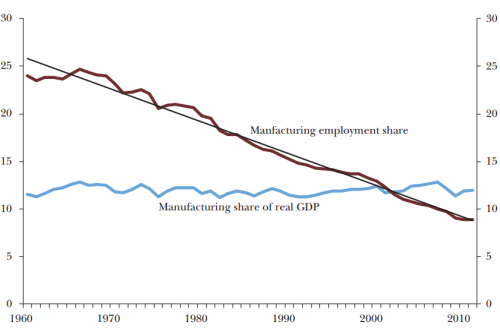
Source: Industry Accounts of the Bureau of Economic Analysis- US Manufacturing: Understanding Its Past and Its Potential Future- Martin Neil Baily and Barry P. Bosworth
To sum up, I have this provoking insight from
Neil Pasricha’s book Happiness Equation,
“Ninety-seven percent of lung cancer patients are smokers and ninety-seven percent of smokers never get lung cancer.”
So does this data point give smokers the excuse as 3% of the smokers get lung cancer? No the question to ask is what are the other life threatening diseases smoking causes?
You can manipulate and twist statistics to your advantage, hence it warrants that you view the issue holistically and not get swayed easily with statistics just as we do with miniskirts.
-
Previous Post
Linkedin Profile Photo Really Matters!!!
Related Posts
The 2028 Rhyme: Why the Next President Is Likely to Be Born After 1977
Forget personalities. The generational math of 2028 is already taking shape. Political leadership in the…

How to win or draw in 4th inning of cricket test match Overseas?
If you are an Indian cricket supporter, you were disappointed one more time this weekend.…
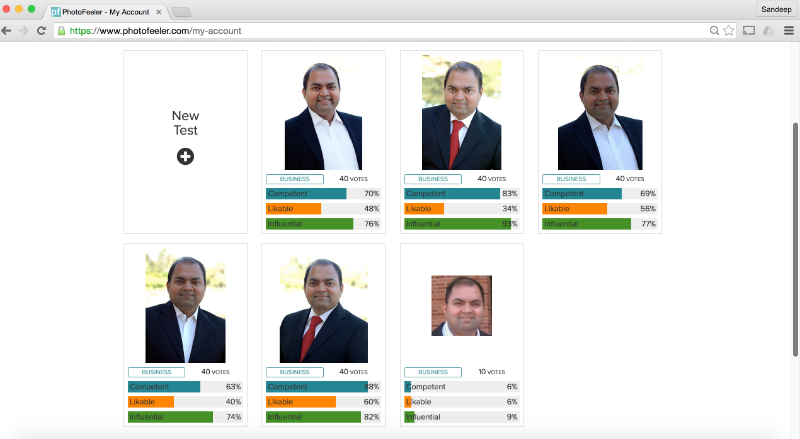
Linkedin Profile Photo Really Matters!!!
One of my friends recently saw my professional profile photo and politely told me that…
binance registracija
February 3, 2026Your article helped me a lot, is there any more related content? Thanks! https://accounts.binance.info/es-MX/register-person?ref=GJY4VW8W