
U.S. Treasury Secretary Scott Bessent offered a different take on the recent market turmoil.
“If I were to analyze in my old hat, and this is the only time I’m going to talk about it … what’s happening with the market I’d say it’s more a Mag 7 problem, not a MAGA problem,” Bessent, a former hedge fund manager tapped by Trump, told Tucker Carlson on April 4, 2025.
“For everyone who thinks these market declines are all based on the President’s economic policies, I can tell you that this market decline started with the Chinese AI announcement of DeepSeek.” Bessent’s view pins the correction on global tech competition, not just domestic policy, though tariffs still loom large for these globally entwined giants.
Is Secretary Bessent’s claim accurate, or is he dodging the deeper causes of today’s market unrest?
To truly understand the Magnificent Seven’s current predicament—Apple, Microsoft, Nvidia, Amazon, Alphabet, Meta, and Tesla—we need to step back.
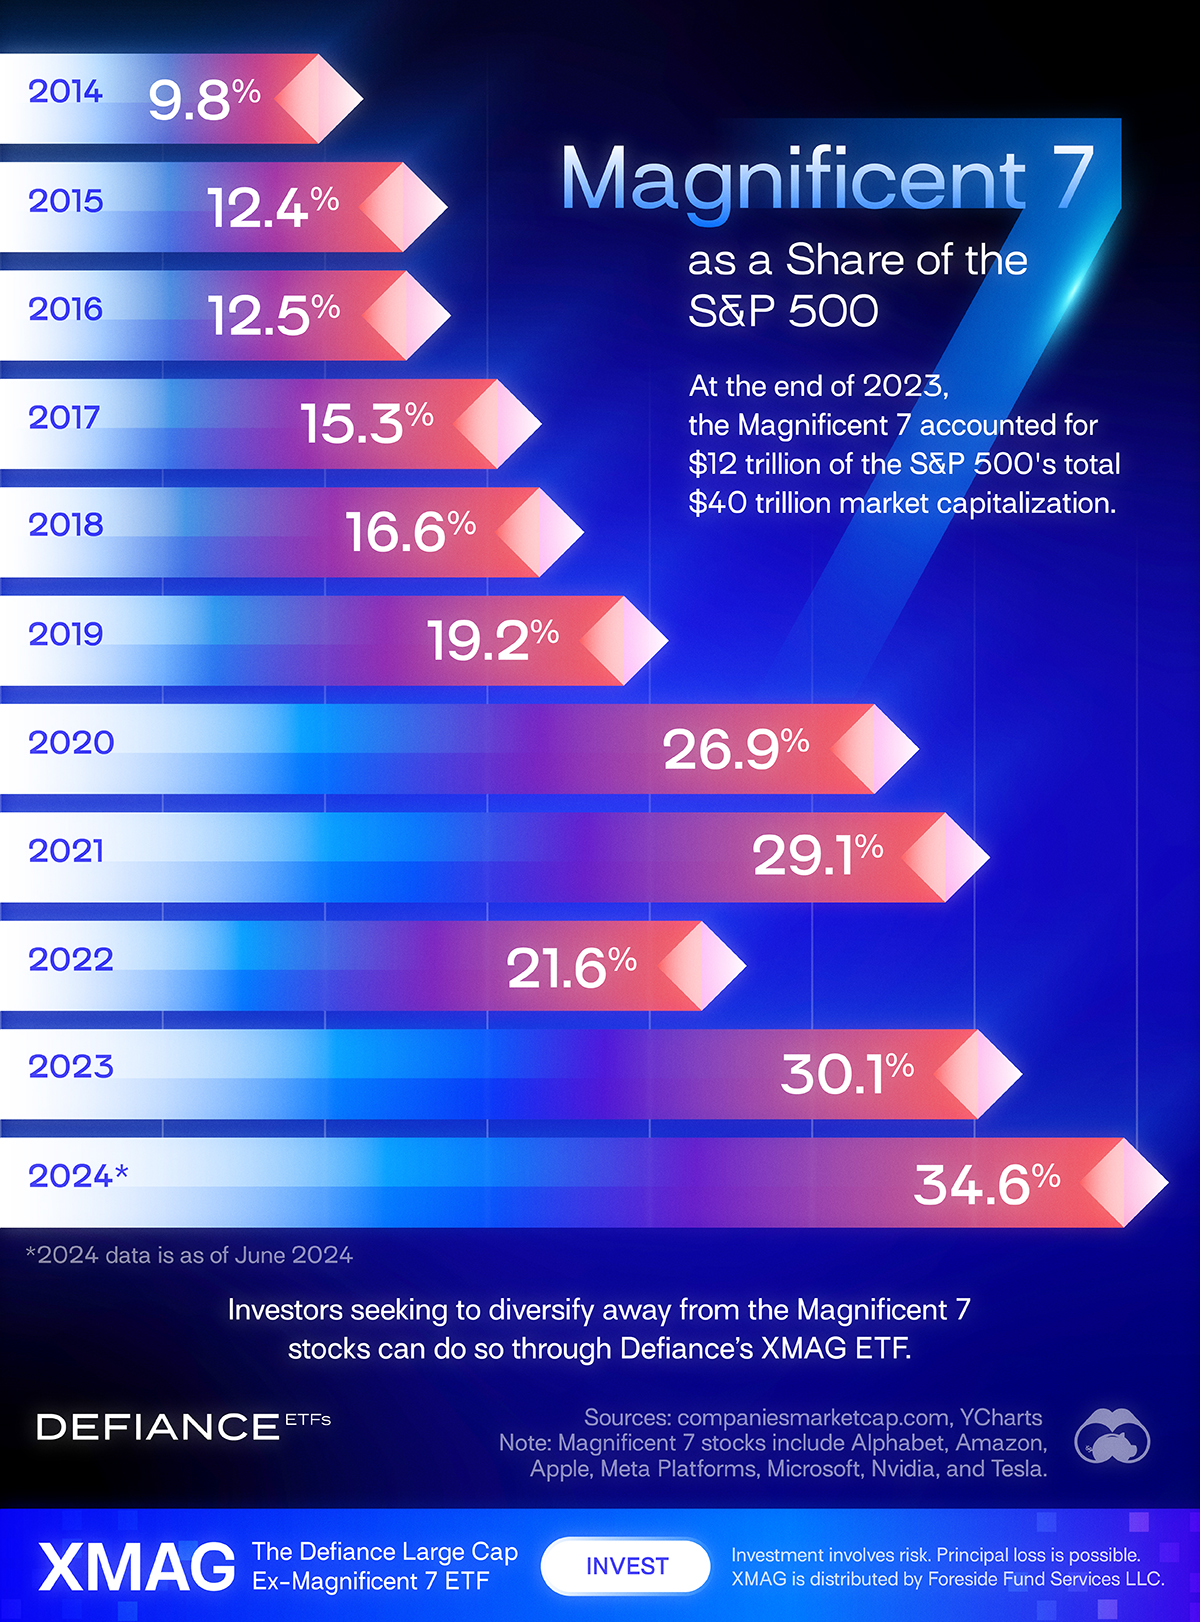
The S&P 500 has been a barometer of the U.S. economy for decades, and its top 7 companies by market cap have often reflected the era’s defining industries.
Over the past 45 years, their share of the index has typically hovered between 10–15%, a sweet spot that ensured diversity across sectors. Today’s tech-heavy 27.8% is an outlier, raising questions about sustainability. Let’s explore this 45-year journey to see how the top 7’s influence has evolved, from oil and industrials to dot-com dreams and now a tech-dominated landscape facing global headwinds.
1980: The Age of Oil and Industry
In 1980, the S&P 500’s total market cap hovered around $1 trillion. The top 7—IBM, Exxon, AT&T, General Motors, Standard Oil of California (Chevron), Mobil, and General Electric—collectively held about $151 billion, or 15.1% of the index. Energy ruled the roost, with oil companies riding the tailwind of the 1970s energy crises. IBM stood out as the tech pioneer, launching the PC era, but the market was a balanced mix of industrial might and resource giants.
2000: Dot-Com Dreams and Conglomerate Kings
Fast forward to 2000, and the S&P 500 had ballooned to $11.7 trillion amid the dot-com bubble. General Electric led the pack at $500 billion, joined by Microsoft, Cisco, ExxonMobil, Intel, Wal-Mart, and Citigroup. Their combined $2.375 trillion accounted for 20.3% of the index—the highest concentration we’d see until the 2020s. Tech stocks like Cisco ($557 billion peak) soared, only to crash soon after, while GE’s conglomerate model and ExxonMobil’s oil resurgence kept the top 7 diverse.
2005: A Balanced Recovery
By 2005, post-dot-com recovery brought the S&P 500 to $12 trillion. GE and ExxonMobil swapped spots, with Microsoft, Citigroup, Wal-Mart, Pfizer, and Johnson & Johnson rounding out the top 7. Their $1.83 trillion total represented 15.3% of the index—a dip from 2000’s peak. Rising oil prices lifted ExxonMobil, while financials (Citigroup) and healthcare (Pfizer) signaled a pre-crisis equilibrium before the 2008 storm.
2010: Post-Crisis Resilience
After the financial crisis, the S&P 500 stabilized at $12.5 trillion in 2010. ExxonMobil reclaimed the top spot, followed by Apple, Microsoft, Wal-Mart, GE, Berkshire Hathaway, and Chevron. Their $1.57 trillion combined market cap was just 12.6% of the total—the lowest in our timeline. Apple’s iPhone-driven ascent hinted at tech’s future, but energy and industrials still held firm in a battered market.
2015: Tech Takes the Lead
By 2015, the S&P 500 hit $18.8 trillion, and tech began its takeover. Apple ($586 billion), Microsoft, ExxonMobil, GE, Johnson & Johnson, Wells Fargo, and Amazon totaled $2.539 trillion, or 13.5% of the index. Amazon’s e-commerce rise and Microsoft’s cloud pivot joined Apple’s dominance, though energy (ExxonMobil) and legacy players (GE) lingered, keeping concentration moderate.
2020: The Magnificent Seven Emerge
The COVID-19 pandemic turbocharged tech in 2020, pushing the S&P 500 to $33.5 trillion. Enter the “Magnificent Seven”: Apple ($2.25 trillion), Microsoft, Amazon, Alphabet, Facebook (Meta), Tesla, and Berkshire Hathaway (a brief outlier). Their $8.751 trillion haul was a whopping 26.1% of the index. Tesla’s EV surge and remote-work tech gains marked a seismic shift toward digital dominance.
2024 (December Peak): The Tech Zenith
December 17, 2024, was the high-water mark. The S&P 500 reached $54.5 trillion, and the Magnificent Seven—Apple ($3.785 trillion), Nvidia, Microsoft, Alphabet, Amazon, Meta, and Tesla—hit $17.62 trillion, or 32.3% of the index (some sources round to 33%). Nvidia’s AI boom ($3.289 trillion) and Apple’s peak drove this unprecedented concentration, dwarfing the broader market like never before.
2025 (April 4): A Correction Sets In
By April 4, 2025, the party had cooled significantly. The S&P 500 dropped to $50 trillion after a 14% slide since February, erasing $10 trillion. The Magnificent Seven—still Apple, Microsoft, Nvidia, Amazon, Alphabet, Meta, and Tesla—fell to $13.88 trillion, or 27.8% of the index. Nvidia’s earlier $600 billion single-day loss on January 27, 2025—triggered by fears of competition from China’s DeepSeek AI—set the tone for a rocky year, and by April 4, it shed another $190 billion in a single day as U.S.-China trade tensions and tariff fears intensified, echoing Bessent’s point about global competition driving the decline more than domestic policy.
The Big Picture
Here’s how the top 7’s share of the S&P 500 has trended:
| Year | Top 7 % of S&P 500 |
| 1980 | 15.1% |
| 2000 | 20.3% |
| 2005 | 15.3% |
| 2010 | 12.6% |
| 2015 | 13.5% |
| 2020 | 26.1% |
| 2024 (Dec) | 32.3% |
| 2025 (Apr) | 27.8% |
From oil and industrials in 1980 to dot-com exuberance in 2000, then a tech-driven surge peaking in 2024, the top 7’s influence mirrors the economy’s evolution. Historically, their share settled between 10–15%—a sustainable range for a diversified index.
Today’s 27.8% remains sky-high, and the Magnificent Seven’s global exposure could drag it lower.
Apple (60%), Microsoft (50%), Nvidia (73%), Amazon (40%), Alphabet (54%), Meta (52%), and Tesla (58%) average ~55.3% of their revenues from outside the U.S., leaning on markets like China and Europe.
Tariffs could hike costs, disrupt supply chains, and trigger retaliation, squeezing margins. To normalize to 10–15%, their $13.88 trillion market cap might need to shed $5–8 trillion, potentially unseating some for less tariff-exposed sectors like healthcare or domestic energy.
The 1980s and 2000s balanced power across industries; today’s tech tilt, as Bessent suggests, faces global headwinds beyond just policy.
What’s your take on the next top 7? Share below!
Data sourced from GROK, historical records, YCharts, Visual Capitalist, X posts, Reuters, and company 10-K filings, with estimates for earlier years.
Related Posts
Does Nvidia Stock Mania resemble Cisco in late 1990s?
My friend Deb is in her 70s, invested in Nvidia back in 2017 at stock…

GenAI- True Adoption in enterprise today?
Generative Artificial Intelligence (GenAI) has been making headlines the past year since ChatGPT launched in…

How does David take on and become Goliath? Startups disrupting industry leaders
We love the story of David and Goliath. The biblical young small David hits the…

4 steps for taking your idea from conceptualization to execution
We all get ideas either in the shower or while driving in traffic or while…